

Happy Unicorns? One Billion+ StartUps and the UN's World Happiness Report
SQL (analysis) & Excel (visualizations)
I was browsing for an interesting dataset on Kaggle while the TV reporter at the background was talking about Israel climbing up to the 9th place in the United Nation's World Happiness Report of 20231 (click here for the dashboard).2
I then saw the dataset about Unicorns - StartUps with evaluation of USD 1+ Billion.3
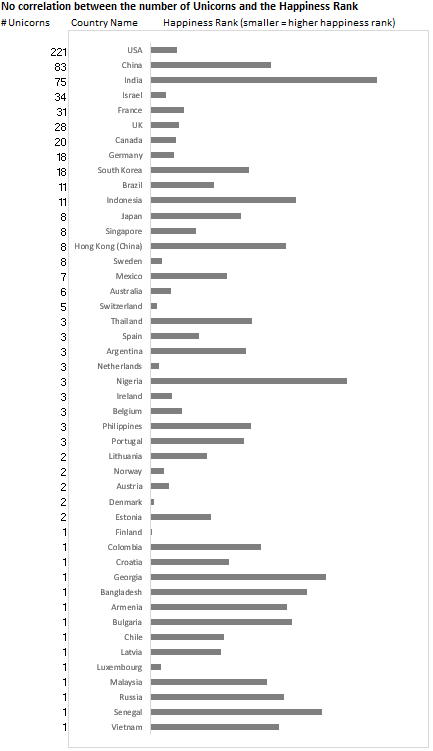
I was curious if there was any relationship between Happiness and Unicorns.
Although I was quick to find out that there wasn't, I decided to follow up on some examinations given the even more interesting questions asked by Gallup4 since they survey folks around the world for the report, which I thought were very relevant for an environment resulting with successful startups.
But TL;DR— I found no evidence to suggest that.
I did decide, however, to visualize and post it here because it was quite a challenge to decide how I should communicate these findings of "lack of correlation."
Insight from this practice:
In analytics, we often face data without clear correlations / significant correlation. In such instances, I advocate for minimalist, color-sparse visuals. Color should highlight key points, and here, the key point is the lack of correlation. Its absence would enable any presenter to convey the point forcefully.
I present the findings first & then note the SQL written to load and analyze this data (visualizations made with Excel).
Visualizations
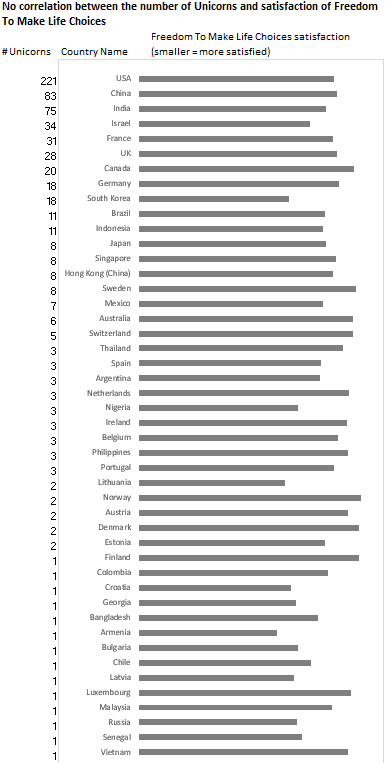
People were asked "are you dissatisfied with your freedom to choose what to do with your life?" with a binary response option of No (0) and Yes (1).
I expected to see people were more satisfied where more unicorns existed. But as shown below, that's not what the data suggests.
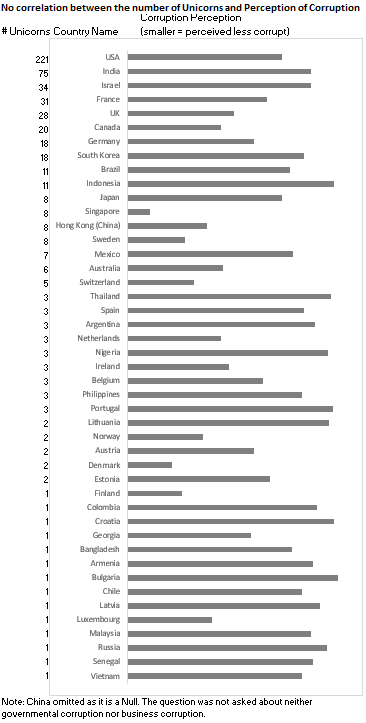
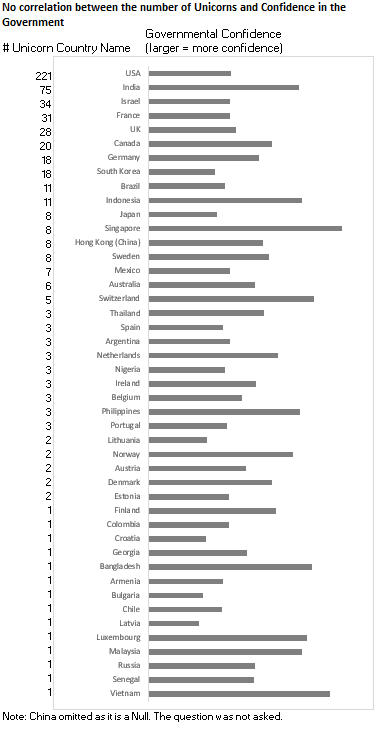
Similarly, I expected perceptions of corruption and confidence in the government to be favorable to unicorns. But such evidence was not found.
People were asked “Is corruption widespread throughout the government in this country or not?” and “Is corruption widespread within businesses in this country or not?” (Where data for government corruption are missing, the perception of business corruption is used as the overall corruption-perception measure).
Similar question was asked for confidence in the government.
Bottom line:
In analytics, we often face data without clear correlations / significant correlation. In such instances, I advocate for minimalist, color-sparse visuals. Color should highlight key points, and here, the key point is the lack of correlation. Its absence would enable any presenter to convey the point forcefully.
Technical notes: The SQL written to load and analyze this data.
Microsoft's SQL Server Management Studio.
----DROP TABLE: UNICORNS
IF OBJECT_ID('unicorns', 'U') IS NOT NULL
  DROP TABLE unicorns;

---CREATE unicorns
CREATE TABLE unicorns (
    Company varchar(50) NOT NULL,
	Valuation FLOAT NOT NULL,
	Industry varchar(100) NULL,
	Country VARCHAR(50) NOT NULL,
	ValuationDate DATE NOT NULL
);

---LOAD CSV unicornslist to load unicorns
BULK INSERT unicorns
FROM 'C:\Users\-----------\Desktop\Happiness and Unicorns\unicornslist.csv'
WITH (
FORMAT='CSV',
FIRSTROW=2
);

----
----DROP TABLE happiness
IF OBJECT_ID('happiness', 'U') IS NOT NULL
  DROP TABLE happiness;

---CREATE happiness table
CREATE TABLE happiness (
 CountryName VARCHAR(50) NOT NULL,
 RegionalIndicator VARCHAR(50) NULL,
 Year DATE NULL,
 LifeLadder FLOAT NULL,
 LogGDPPerCapita FLOAT NULL,
 SocialSupport FLOAT NULL,
 HealthyLifeExpectancyAtBirth decimal(5,3) NULL,
 FreedomToMakeLifeChoices FLOAT NULL,
 Generosity FLOAT NULL,
 PerceptionsOfCorruption FLOAT NULL,
 PositiveAffect FLOAT NULL,
 NegativeAffect FLOAT NULL,
 ConfidenceInNationalGovernment FLOAT NULL
);

---LOAD CSV happiness world report to load happiness
BULK INSERT happiness
FROM 'C:\Users\-----------\Desktop\Happiness and Unicorns\worldhappinessreport.csv'
WITH (
FORMAT='CSV',
FIRSTROW=2
);
------ Analysis Part
-- CTE Part
WITH numUniCo AS (SELECT Country
, count(Company) AS unicornsNum
FROM unicorns
GROUP BY Country
),
hapi AS (SELECT CountryName
, AVG(LifeLadder) AS AVG_LifeLadder
, AVG(FreedomToMakeLifeChoices) AS AVG_FreedomToMakeLifeChoices
, AVG(PerceptionsOfCorruption) AS AVG_CorruptionPerception
, AVG(ConfidenceInNationalGovernment) AS AVG_GovtConfidence
, AVG(SocialSupport) AS AVG_SocialSupport
, AVG(Generosity) AS AVG_Generosity
, AVG(PositiveAffect) AS AVG_PositiveAffect
, AVG(NegativeAffect) AS AVG_NegativeAffect
FROM happiness
WHERE CountryName IN (SELECT Country
FROM numUniCo)
GROUP BY CountryName
)
---- Final Query
SELECT CountryName
, numUniCo.unicornsNum AS TotalUnicorns
, AVG_LifeLadder
, AVG_FreedomToMakeLifeChoices
, AVG_CorruptionPerception
, AVG_GovtConfidence
, AVG_SocialSupport
, AVG_Generosity
, AVG_PositiveAffect
, AVG_NegativeAffect
FROM hapi
JOIN numUniCo
ON hapi.CountryName = numUniCo.Country
ORDER BY 2 DESChttps://happiness-report.s3.amazonaws.com/2022/WHR+22.pdf
https://worldhappiness.report/data/
https://www.kaggle.com/datasets/rajkumarpandey02/list-of-unicorn-startup-companies
https://www.gallup.com/